Fig. 15
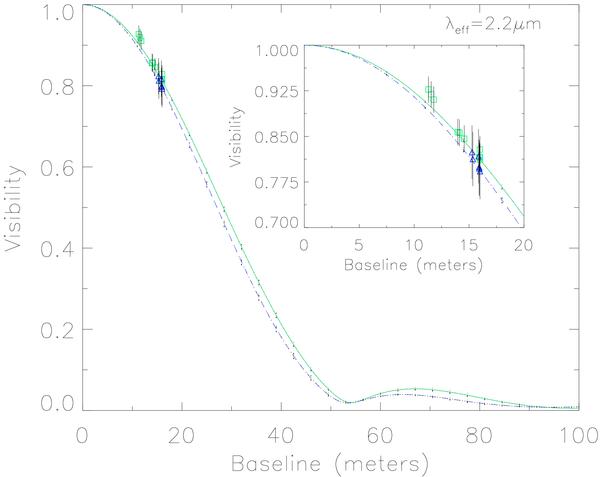
Cycle-to-cycle averaged visibility profiles of the best dynamic model (green solid line: phase 0.17; blue dashed line: phase 0.23) superimposed on the VINCI data at phase 0.17 (green squares) and phase 0.23 (blue triangles). Dotted error bars give the dispersion created by the cycle-to-cycle variation. In the inset, a zoom of the relevant frequency region is represented.
Current usage metrics show cumulative count of Article Views (full-text article views including HTML views, PDF and ePub downloads, according to the available data) and Abstracts Views on Vision4Press platform.
Data correspond to usage on the plateform after 2015. The current usage metrics is available 48-96 hours after online publication and is updated daily on week days.
Initial download of the metrics may take a while.