Fig. 13
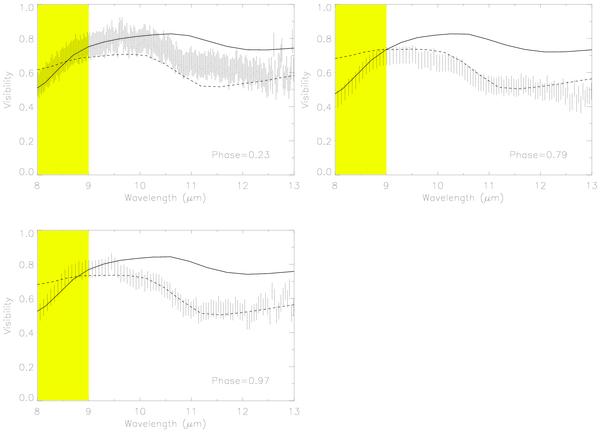
Comparison of the visibility of the best dynamic model (solid line) with the best-fitting COMARCS+DUSTY model (dashed line; see Sect. 4.2.1) superimposed on the 60 m MIDI visibility data (error bars) at phases 0.23/0.79/0.97 (data sets #1, #7, and #21, respectively). The yellow zone corresponds to the region dominated by warm molecular layers.
Current usage metrics show cumulative count of Article Views (full-text article views including HTML views, PDF and ePub downloads, according to the available data) and Abstracts Views on Vision4Press platform.
Data correspond to usage on the plateform after 2015. The current usage metrics is available 48-96 hours after online publication and is updated daily on week days.
Initial download of the metrics may take a while.