Free Access
Fig. 19
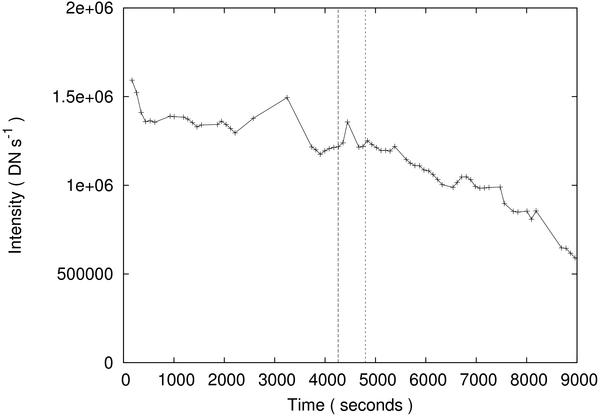
Lightcurve for the off-limb area in Fig. 16 created from images taken with the XRT C_poly filter. The dashed lines indicate the beginning and end of the EIS raster across this area.
Current usage metrics show cumulative count of Article Views (full-text article views including HTML views, PDF and ePub downloads, according to the available data) and Abstracts Views on Vision4Press platform.
Data correspond to usage on the plateform after 2015. The current usage metrics is available 48-96 hours after online publication and is updated daily on week days.
Initial download of the metrics may take a while.