Fig. 7
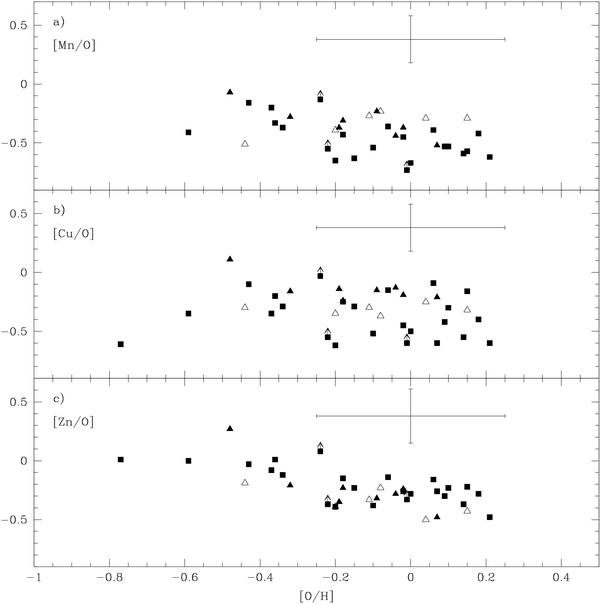
[Mn/O], [Cu/O] and [Zn/O] vs. [O/H]. Error bars are defined as in Fig. 1. Arrows up indicate lower limits for the ratios. Symbols: triangles are results of this work, where filled are barium stars and open, those stars considered to be normal instead of barium stars by Smiljanic et al. (2007); filled squares are data taken from Allen & Barbuy (2006a).
Current usage metrics show cumulative count of Article Views (full-text article views including HTML views, PDF and ePub downloads, according to the available data) and Abstracts Views on Vision4Press platform.
Data correspond to usage on the plateform after 2015. The current usage metrics is available 48-96 hours after online publication and is updated daily on week days.
Initial download of the metrics may take a while.