Free Access
Fig. 3
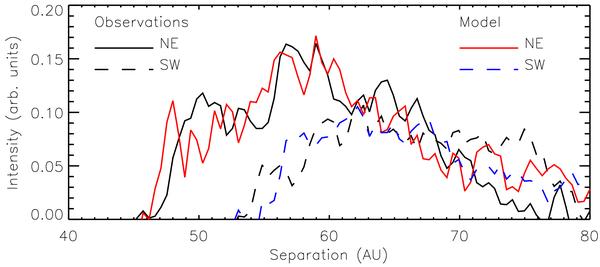
Comparison of a radial cut averaged over 5 pixels through the midplane for the observation reduced with LOCI and the model disk implanted into the reference star and reduced in the same way. The intensity of the SW-side of the model is scaled down by a factor 1.3.
Current usage metrics show cumulative count of Article Views (full-text article views including HTML views, PDF and ePub downloads, according to the available data) and Abstracts Views on Vision4Press platform.
Data correspond to usage on the plateform after 2015. The current usage metrics is available 48-96 hours after online publication and is updated daily on week days.
Initial download of the metrics may take a while.