Fig. 5
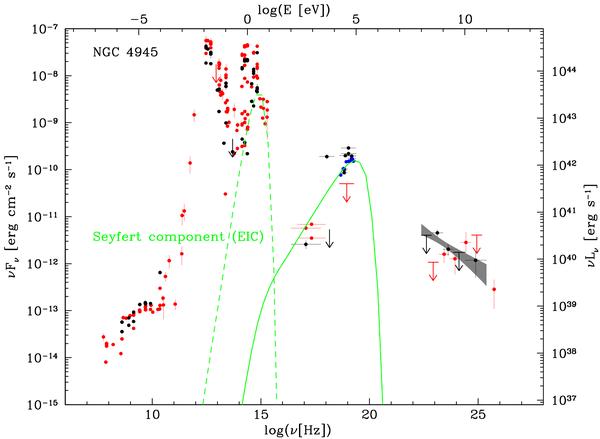
Spectral energy distribution of NGC 4945, including the Fermi/LAT spectrum (black points). For clarity, we only show the INTEGRAL IBIS/ISGRI data in blue in the hard X-rays. The model for the EIC component from the accretion disc is shown in green. We show in red the data of NGC 253 as taken from the NED, with the Fermi/LAT spectrum published in Abdo et al. (2010c) as well as the H.E.S.S. flux measurement from Acero et al. (2009), for comparison. The two objects have clearly very similar SEDs. The luminosity axis on the right is given for NGC 4945.
Current usage metrics show cumulative count of Article Views (full-text article views including HTML views, PDF and ePub downloads, according to the available data) and Abstracts Views on Vision4Press platform.
Data correspond to usage on the plateform after 2015. The current usage metrics is available 48-96 hours after online publication and is updated daily on week days.
Initial download of the metrics may take a while.