Fig. 4
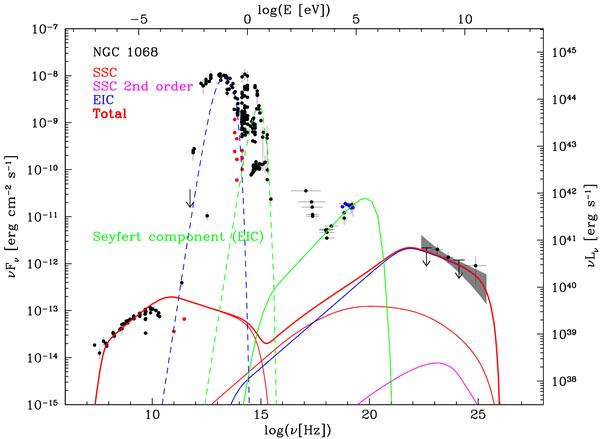
Spectral energy distribution of NGC 1068, including the Fermi/LAT spectrum. The black and red points are archival data from the NED, the red ones denote data taken from the central region of NGC 1068. For clarity, we only show the INTEGRAL IBIS/ISGRI data in blue in the hard X-rays. The EIC model for the outflow is shown in blue, and the corresponding SSC emission is shown in thin red and magenta lines for first and second order components, respectively. The thick red line shows the sum of the different emission components from the large outflow. The EIC component from the accretion disc is shown in green.
Current usage metrics show cumulative count of Article Views (full-text article views including HTML views, PDF and ePub downloads, according to the available data) and Abstracts Views on Vision4Press platform.
Data correspond to usage on the plateform after 2015. The current usage metrics is available 48-96 hours after online publication and is updated daily on week days.
Initial download of the metrics may take a while.