Free Access
Fig. 2
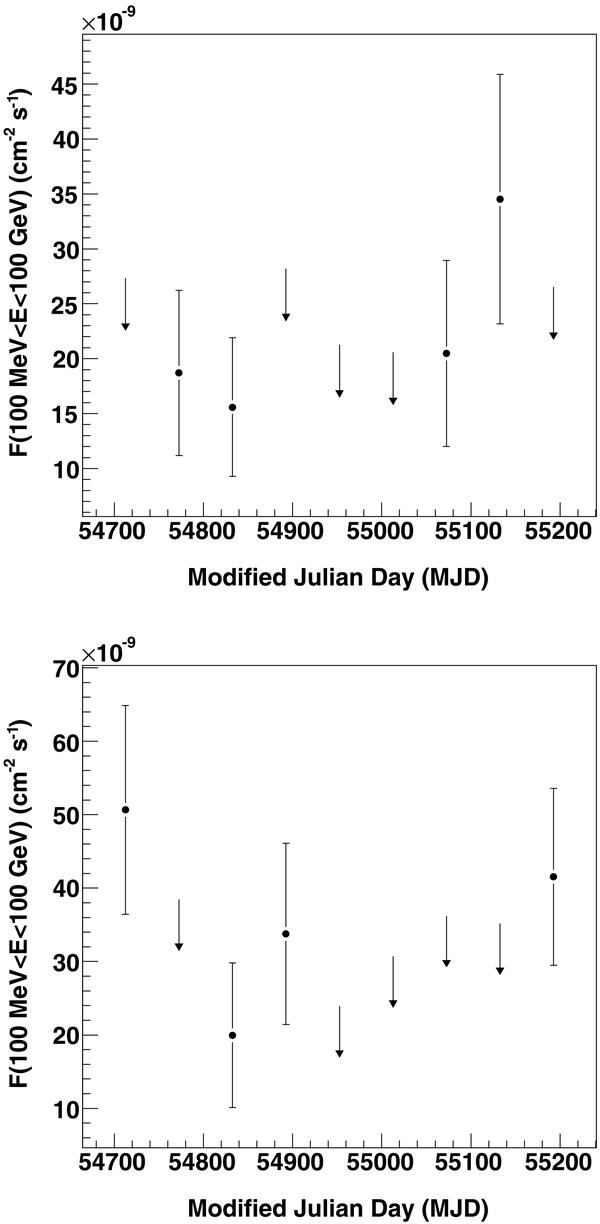
Top: light curve of NGC 1068 in the 100 MeV−100 GeV energy band. The time bins are 60 days wide, and the arrows represent 95% CL upper limits. Bottom: same as top for NGC 4945. In both sources, no significant variability is visible.
This figure is made of several images, please see below:
Current usage metrics show cumulative count of Article Views (full-text article views including HTML views, PDF and ePub downloads, according to the available data) and Abstracts Views on Vision4Press platform.
Data correspond to usage on the plateform after 2015. The current usage metrics is available 48-96 hours after online publication and is updated daily on week days.
Initial download of the metrics may take a while.