Fig. 1
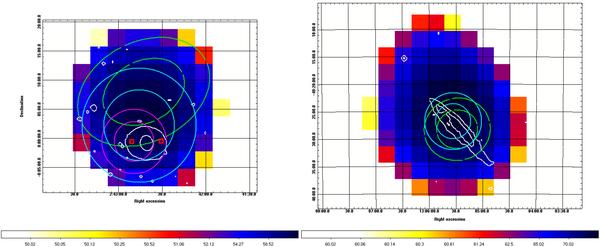
Left: TS map of NGC 1068 between 100 MeV and 100 GeV. The green ellipses show the 68% and the 95% position errors from the 1FGL catalogue, the cyan and magenta circles show respectively the position error (at 68% and 95% CL) for the full data set with all the events accounted for, and for front events only. The white contours are taken from an optical image from the Digital Sky Survey, showing the extent of the Seyfert galaxy. The red boxed points denote the position of the two quasars nearby NGC 1068 (see text in Sect. 4 for more details). Right: same as left panel, for NGC 4945. For clarity, we only present here the position error circle for all events.
Current usage metrics show cumulative count of Article Views (full-text article views including HTML views, PDF and ePub downloads, according to the available data) and Abstracts Views on Vision4Press platform.
Data correspond to usage on the plateform after 2015. The current usage metrics is available 48-96 hours after online publication and is updated daily on week days.
Initial download of the metrics may take a while.