Free Access
Fig. 9
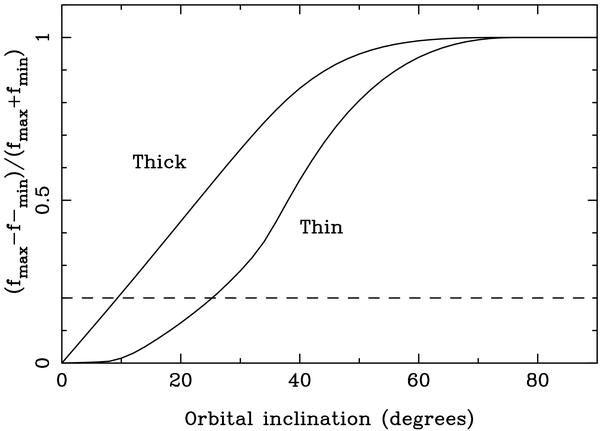
The modulation of irradiation-induced line emission from the secondary star versus orbital inclination. Both optically thin and optically thick cases are indicated. The dashed line indicates the level of modulation of the central sinusoidal component seen in the data.
Current usage metrics show cumulative count of Article Views (full-text article views including HTML views, PDF and ePub downloads, according to the available data) and Abstracts Views on Vision4Press platform.
Data correspond to usage on the plateform after 2015. The current usage metrics is available 48-96 hours after online publication and is updated daily on week days.
Initial download of the metrics may take a while.