Fig. 3
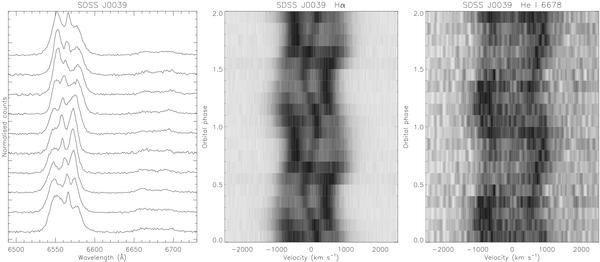
(1) Phase-binned and stacked spectra of SDSS J0039. The spectra have been continuum-normalised and plotted with offsets of +3. (2) Phase-binned and trailed spectra in the region of Hα. (3) Phase-binned and trailed spectra in the region of the He I 6678 Å emission line. The He I spectra have been smoothed with a Savitsky-Golay filter for display purposes.
Current usage metrics show cumulative count of Article Views (full-text article views including HTML views, PDF and ePub downloads, according to the available data) and Abstracts Views on Vision4Press platform.
Data correspond to usage on the plateform after 2015. The current usage metrics is available 48-96 hours after online publication and is updated daily on week days.
Initial download of the metrics may take a while.