Fig. 8
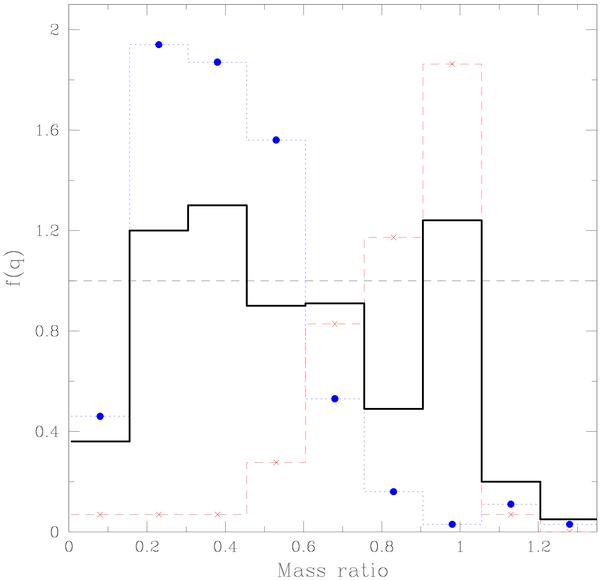
The mass ratio distribution for the whole sample of 162 systems studied in this paper. The dashed red histogram corresponds to the observed distribution for SB2 systems, while the blue dotted one is the q-distribution obtained from a Richardson-Lucy (R-L) inversion of the sub-sample of SB1 systems. The Am star mass ratio distribution is thus the sum of the two distributions. The black heavy line shows the mass ratio distribution as derived from a R-L inversion of the whole sample of SBs, giving a distribution which is comparable to half the sum of the two distributions.
Current usage metrics show cumulative count of Article Views (full-text article views including HTML views, PDF and ePub downloads, according to the available data) and Abstracts Views on Vision4Press platform.
Data correspond to usage on the plateform after 2015. The current usage metrics is available 48-96 hours after online publication and is updated daily on week days.
Initial download of the metrics may take a while.