Free Access
Fig. 7
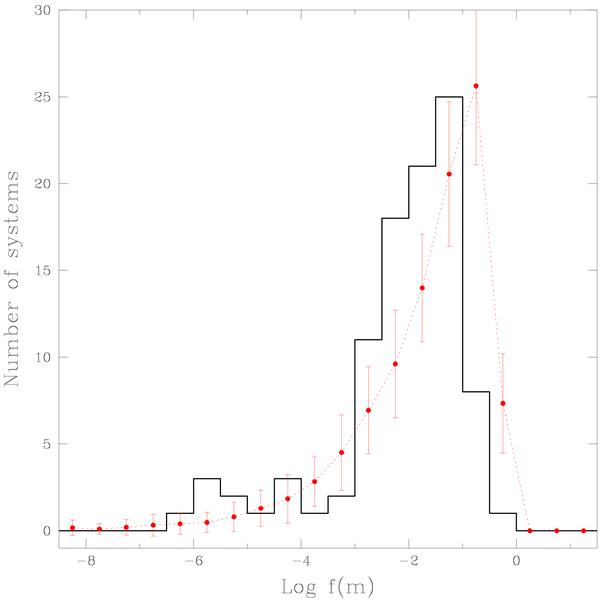
The distribution of the logarithm of the mass function for the sub-sample of SB1 (black histogram) is compared to the one obtained by assuming that the mass ratio distribution is constant (heavy dots with error bars connected by the thick line). The errors bars are the results of 1000 Monte Carlo simulations.
Current usage metrics show cumulative count of Article Views (full-text article views including HTML views, PDF and ePub downloads, according to the available data) and Abstracts Views on Vision4Press platform.
Data correspond to usage on the plateform after 2015. The current usage metrics is available 48-96 hours after online publication and is updated daily on week days.
Initial download of the metrics may take a while.