Free Access
Fig. 5
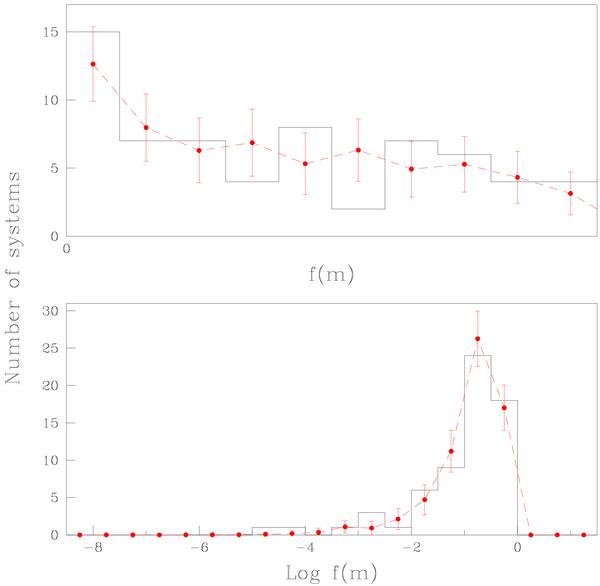
Comparison between the observed distribution of the mass function (upper panel) of the sub-sample of SB2 and of its logarithm (lower) with the computed distributions, using the observed mass ratios (see Fig. 4), a primary mass of 2 M⊙, and a random inclination.
Current usage metrics show cumulative count of Article Views (full-text article views including HTML views, PDF and ePub downloads, according to the available data) and Abstracts Views on Vision4Press platform.
Data correspond to usage on the plateform after 2015. The current usage metrics is available 48-96 hours after online publication and is updated daily on week days.
Initial download of the metrics may take a while.