Fig. 3
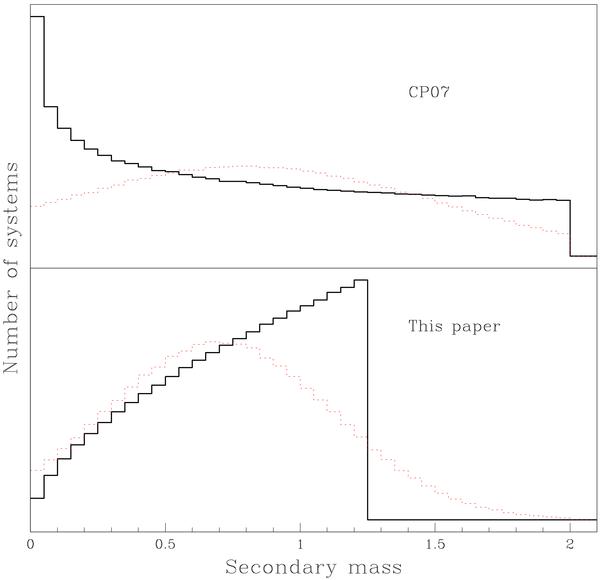
The distribution of the secondary masses for the sample of CP07. The upper panel shows the mass distribution obtained by these authors: either a power law (thick black line) or a Gaussian centred around 0.8 M⊙ and with σM = 0.5 M⊙ (thin dotted red line). The two distributions are in fact very smooth and compatible with a uniform distribution. The bottom panel shows the distributions which best fit the sample of CP07 as obtained in this paper, fitting the distribution of log f(m) instead of f(m). The resulting distributions are a truncated power law that increases with mass (thick black line) or a gaussian curve centred around 0.7 M⊙ and with σM = 0.3 M⊙ (thin dotted red line).
Current usage metrics show cumulative count of Article Views (full-text article views including HTML views, PDF and ePub downloads, according to the available data) and Abstracts Views on Vision4Press platform.
Data correspond to usage on the plateform after 2015. The current usage metrics is available 48-96 hours after online publication and is updated daily on week days.
Initial download of the metrics may take a while.