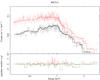
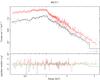
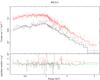
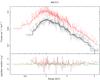
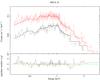
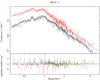
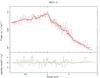
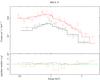
Fig. A.1
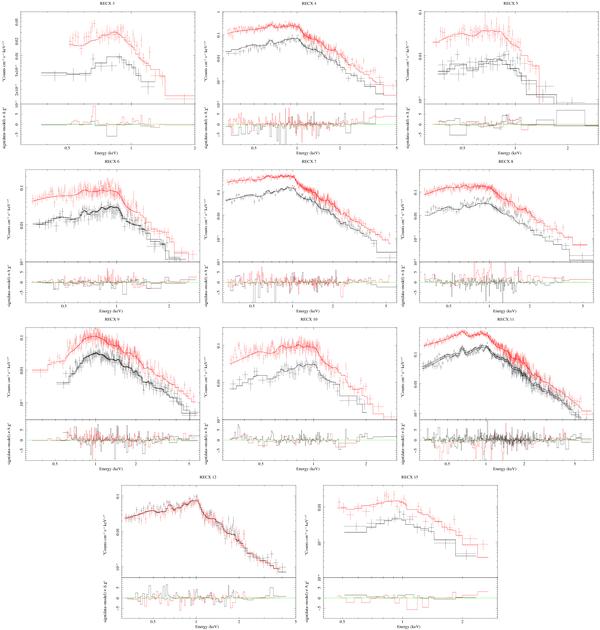
X-ray spectra for known members of η Chamaleontis. Red is for EPIC-pn and black is for EPIC-mos, except for RECX 12 that is located in an EPIC-pn gap. The best fit to each spectrum is also plotted. The bottom panel represents the deviation of the model from the observed spectra in each spectral bin.
Current usage metrics show cumulative count of Article Views (full-text article views including HTML views, PDF and ePub downloads, according to the available data) and Abstracts Views on Vision4Press platform.
Data correspond to usage on the plateform after 2015. The current usage metrics is available 48-96 hours after online publication and is updated daily on week days.
Initial download of the metrics may take a while.