Fig. 3
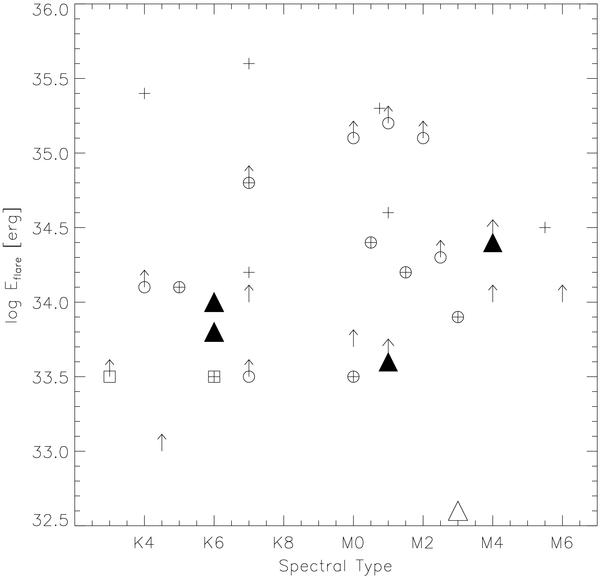
Energy liberated during the flare in the [0.3−8.0] energy band for the stars in our sample (large triangles) and the stars of the XEST (plusses; Stelzer et al. 2007). Upward arrows denote lower limits. Filled triangles are stars with a disk in η Chamaleontis. Stars classified as classical T Tauri in Güdel et al. (2007) are marked with a large symbol (square or circle).
Current usage metrics show cumulative count of Article Views (full-text article views including HTML views, PDF and ePub downloads, according to the available data) and Abstracts Views on Vision4Press platform.
Data correspond to usage on the plateform after 2015. The current usage metrics is available 48-96 hours after online publication and is updated daily on week days.
Initial download of the metrics may take a while.