Free Access
Fig. 7
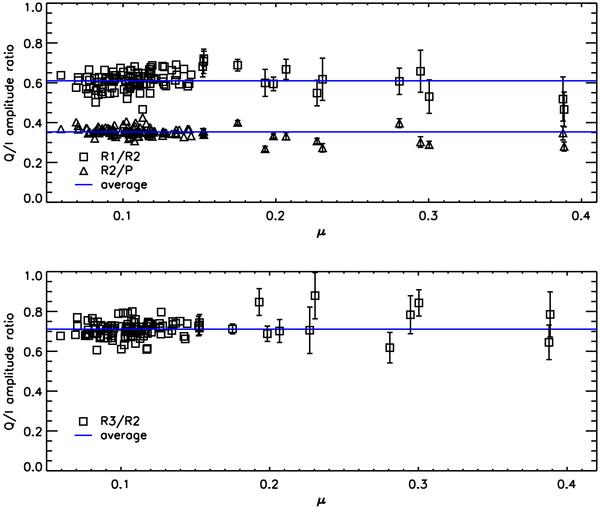
Q/I amplitude ratios vs. limb distance μ. The solid lines represent the overall averages of all data points. For clarity reasons, the error bars are only drawn for measurements with μ > 0.15.
Current usage metrics show cumulative count of Article Views (full-text article views including HTML views, PDF and ePub downloads, according to the available data) and Abstracts Views on Vision4Press platform.
Data correspond to usage on the plateform after 2015. The current usage metrics is available 48-96 hours after online publication and is updated daily on week days.
Initial download of the metrics may take a while.