Fig. 4
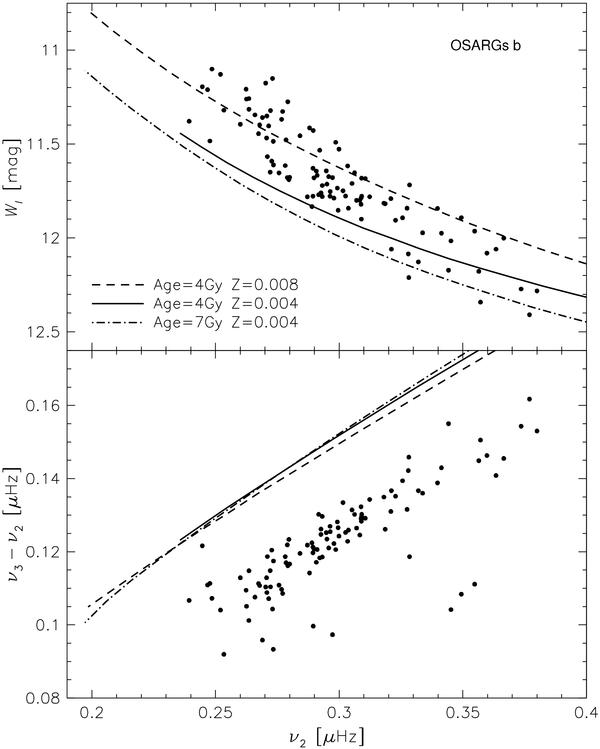
Frequencies of the most significant peaks within the b2 and b3 sequences in selected objects (dots) compared with frequencies of the first two overtones in the models along the three isochrones. The top panel shows the reddening-free magnitude WI as a function of the lower frequency. The bottom one shows the frequency difference.
Current usage metrics show cumulative count of Article Views (full-text article views including HTML views, PDF and ePub downloads, according to the available data) and Abstracts Views on Vision4Press platform.
Data correspond to usage on the plateform after 2015. The current usage metrics is available 48-96 hours after online publication and is updated daily on week days.
Initial download of the metrics may take a while.