Free Access
Fig. 2
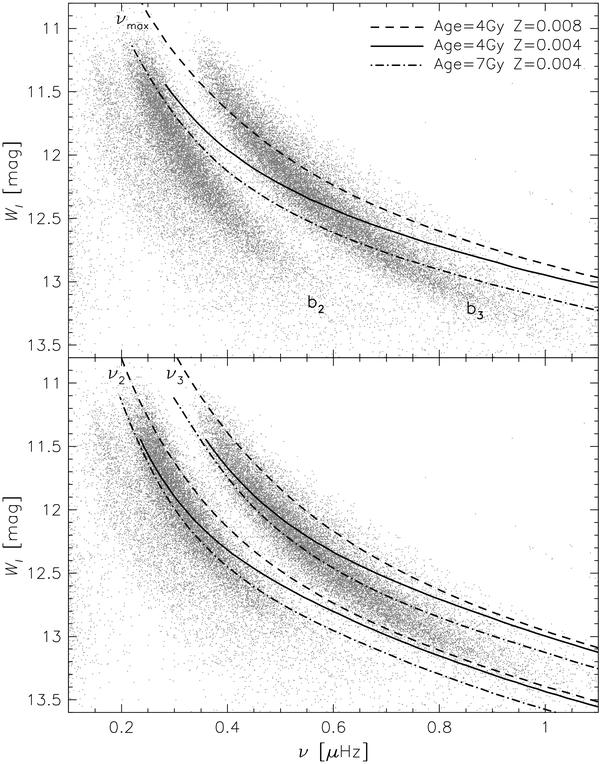
The b1 and b2 sequences in the ν − WI plane compared with the expected positions of power calculated with Eq. (2) (top) and with frequencies of the first two radial overtones, ν2 and ν3 (bottom). The dots show all significant peaks at the S/N = 5 level. Some objects yield points on both sequences.
Current usage metrics show cumulative count of Article Views (full-text article views including HTML views, PDF and ePub downloads, according to the available data) and Abstracts Views on Vision4Press platform.
Data correspond to usage on the plateform after 2015. The current usage metrics is available 48-96 hours after online publication and is updated daily on week days.
Initial download of the metrics may take a while.