Free Access
Fig. 4
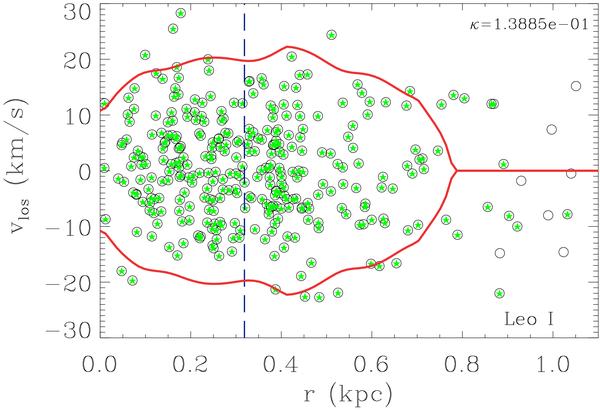
Velocity diagram for Leo I (data from Mateo et al. 2008). The black circles are all the stars in the catalogue, while the circles with a green star are the candidates selected by the binary tree. The red curves are the caustics identifying the members. The blue vertical line represents the mean separation R from the centre.
Current usage metrics show cumulative count of Article Views (full-text article views including HTML views, PDF and ePub downloads, according to the available data) and Abstracts Views on Vision4Press platform.
Data correspond to usage on the plateform after 2015. The current usage metrics is available 48-96 hours after online publication and is updated daily on week days.
Initial download of the metrics may take a while.