Fig. 13
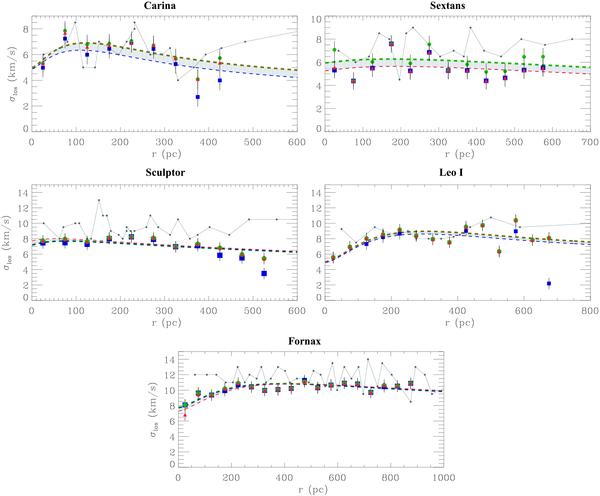
A comparison between the los velocity dispersions found using different star masses in the caustic technique as discussed in Sect. 3.3. The red triangles corresponding to the intermediate caustics are supplemented by blue squares and green circles in each radius bin that signify the two other, extremal sets of caustics. The best MOND fit is given to each series of data points.
Current usage metrics show cumulative count of Article Views (full-text article views including HTML views, PDF and ePub downloads, according to the available data) and Abstracts Views on Vision4Press platform.
Data correspond to usage on the plateform after 2015. The current usage metrics is available 48-96 hours after online publication and is updated daily on week days.
Initial download of the metrics may take a while.