Fig. 8
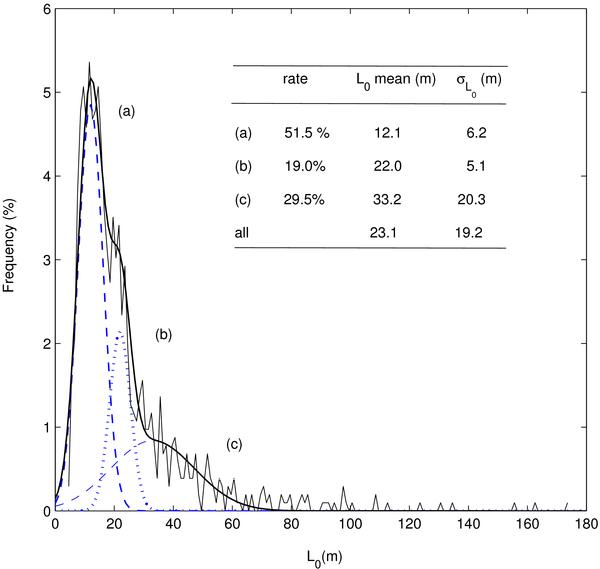
Normalized histograms of outer scale measured with GSM, the curve with solid line shows the fit of the distribution by a sum of three log-normal functions. The separation of the three peaks is presented with three curves (a), (b), and (c) in dotted lines. The mean values, standard deviations, and fraction of each component are listed.
Current usage metrics show cumulative count of Article Views (full-text article views including HTML views, PDF and ePub downloads, according to the available data) and Abstracts Views on Vision4Press platform.
Data correspond to usage on the plateform after 2015. The current usage metrics is available 48-96 hours after online publication and is updated daily on week days.
Initial download of the metrics may take a while.