Fig. 9
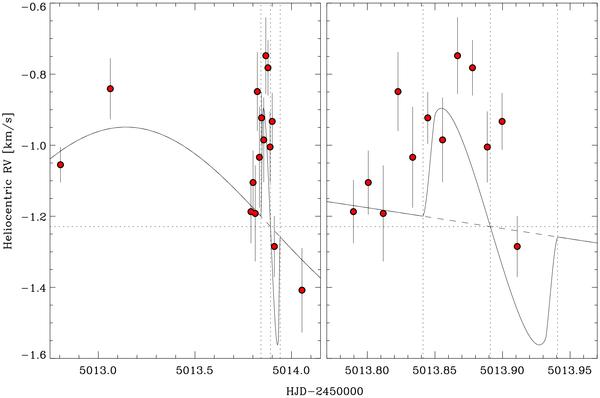
Radial velocities of CoRoT-11 measured with the HIRES spectrograph around the transit that occurred on July 1, 2010. The left panel shows all the RV data and the right panel shows a magnification on the transit. The dashed line shows the Keplerian fit without transit. The solid line shows the Rossiter-McLaughlin anomaly fit for λ = 0°. The vertical dotted lines show the transit first contact, mid-time, and fourth contact. The data have been arbitrarily shifted to the systemic radial velocity of Vr = − 1.229 ± 0.041 km s-1 (horizontal dotted line), as derived from the HARPS/EGGS data-set only.
Current usage metrics show cumulative count of Article Views (full-text article views including HTML views, PDF and ePub downloads, according to the available data) and Abstracts Views on Vision4Press platform.
Data correspond to usage on the plateform after 2015. The current usage metrics is available 48-96 hours after online publication and is updated daily on week days.
Initial download of the metrics may take a while.