Free Access
Fig. 5
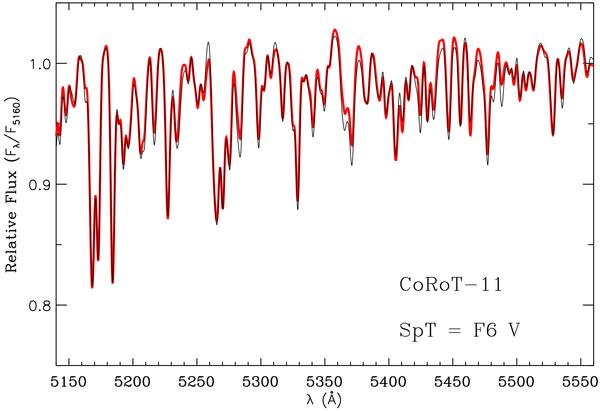
Section of the TLS low-resolution spectrum of CoRoT-11 (thin black line). Overplotted with a thick red line is the best-fitting F6 V template. The spectra have been arbitrarily normalised to the flux at 5160 Å. See the online edition of the Journal for a colour version of this figure.
Current usage metrics show cumulative count of Article Views (full-text article views including HTML views, PDF and ePub downloads, according to the available data) and Abstracts Views on Vision4Press platform.
Data correspond to usage on the plateform after 2015. The current usage metrics is available 48-96 hours after online publication and is updated daily on week days.
Initial download of the metrics may take a while.