Fig. 3
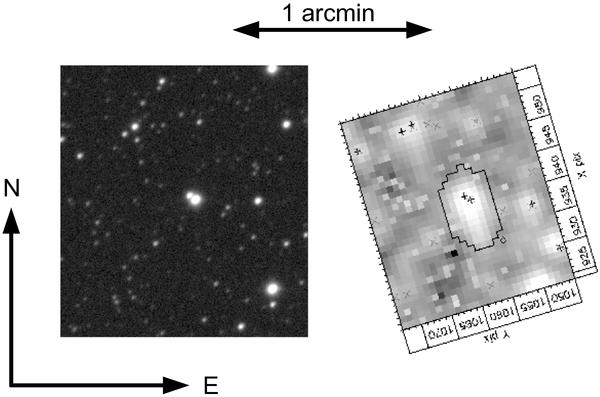
Sky area around CoRoT-11. Left: r′-filter image as retrieved from the ExoDat database. CoRoT-11 is the brightest source in the centre of the image. The nearby contaminant star, about 2″ northwest from the main target, is clearly visible. Right: image acquired by CoRoT, at the same scale and orientation. The thick line around the target delimits the photometric mask used to integrate the signal of CoRoT-11. Note how the target and the contaminant are completely blurred and blended. The crosses in the image mark the position of the stars in the field.
Current usage metrics show cumulative count of Article Views (full-text article views including HTML views, PDF and ePub downloads, according to the available data) and Abstracts Views on Vision4Press platform.
Data correspond to usage on the plateform after 2015. The current usage metrics is available 48-96 hours after online publication and is updated daily on week days.
Initial download of the metrics may take a while.