Fig. 2
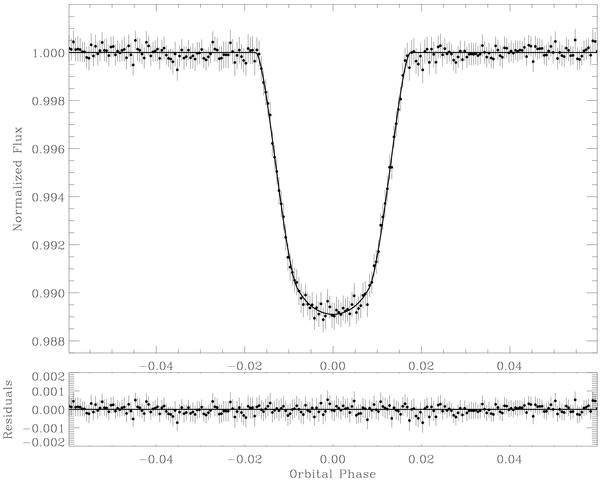
Binned and phase-folded curve of the transit of CoRoT-11b, with the best-fit model over-plotted and the residuals of the fit. The standard deviation of the points outside transit is of 230 ppm (with a phase sampling of 5 × 10⁻⁴, corresponding to about 129 s). The mean error bar of the bins is of 239 ppm, revealing an insignificant amount of red noise in the phase-folded light curve after the corrections described in the text have been performed.
Current usage metrics show cumulative count of Article Views (full-text article views including HTML views, PDF and ePub downloads, according to the available data) and Abstracts Views on Vision4Press platform.
Data correspond to usage on the plateform after 2015. The current usage metrics is available 48-96 hours after online publication and is updated daily on week days.
Initial download of the metrics may take a while.