Fig. 1
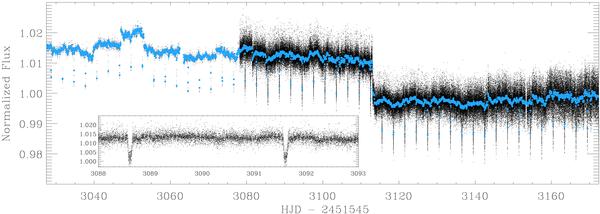
Whole (145 days) cleaned light curve of CoRoT-11, sampled at 512 s from the first ~50 days, and at 32 s until the end of the run. For the sake of clarity, the blue dots represent 1-h binned points. The inset plot is a zoom of the light curve showing two transits of CoRoT-11b. The “jumps” observed in the plot are caused by the impacts of high-energy particles onto the CCD’s lattice. The light curve has been arbitrarily normalised to the median value of the flux. See the online edition of the Journal for a colour version of this figure.
Current usage metrics show cumulative count of Article Views (full-text article views including HTML views, PDF and ePub downloads, according to the available data) and Abstracts Views on Vision4Press platform.
Data correspond to usage on the plateform after 2015. The current usage metrics is available 48-96 hours after online publication and is updated daily on week days.
Initial download of the metrics may take a while.