Fig. 3
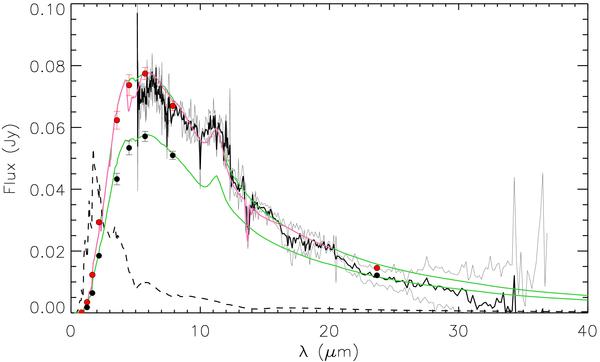
The results of modeling the dust and gas around LPV 28579. The SAGE Epoch 1 (red dots) and epoch 2 (black dots) photometry as well as SAGE-Spec spectrum (black curve) shown with the best-fit 2Dust RT model (green curves) scaled to fit Epoch 1 and Epoch 2 photometry. The photosphere model corresponding to the best-fit SED is also shown (dashed curve). The model SED is convolved with the synthetic molecular spectrum shown in Fig. 2 to reproduce the 13.7 μm feature (pink curve).
Current usage metrics show cumulative count of Article Views (full-text article views including HTML views, PDF and ePub downloads, according to the available data) and Abstracts Views on Vision4Press platform.
Data correspond to usage on the plateform after 2015. The current usage metrics is available 48-96 hours after online publication and is updated daily on week days.
Initial download of the metrics may take a while.