Fig. 2
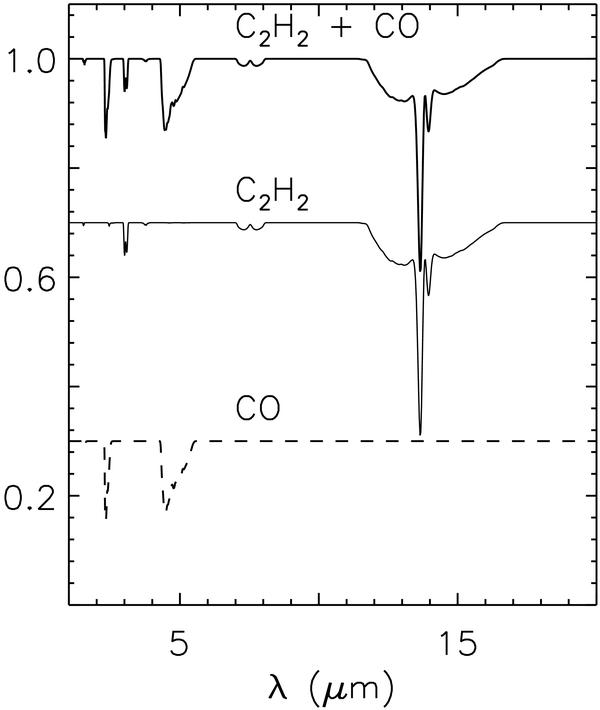
The synthetic spectra for CO (dashed line, column density = 3 × 1021 cm-2) and C2H2 (thin solid line, column density = 1019 cm-2) from the HITRAN database and Rothman et al. (2009). The combined spectrum (thick solid line) used to model the molecular contribution to the observed spectrum is also shown. The spectra for CO and C2H2 are shifted down for clarity.
Current usage metrics show cumulative count of Article Views (full-text article views including HTML views, PDF and ePub downloads, according to the available data) and Abstracts Views on Vision4Press platform.
Data correspond to usage on the plateform after 2015. The current usage metrics is available 48-96 hours after online publication and is updated daily on week days.
Initial download of the metrics may take a while.