Fig. 1
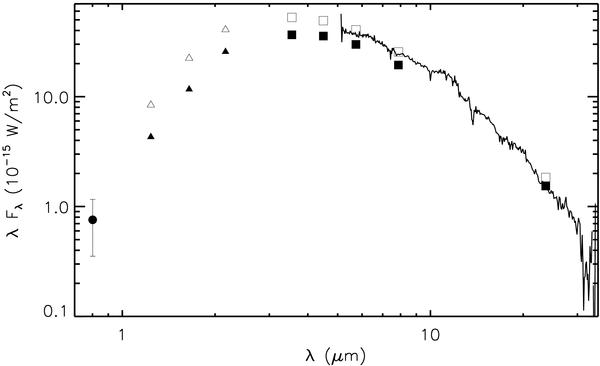
A compilation of photometric and spectroscopic information for LPV 28579. The solid circle and error bar show the mean OGLE I band flux and its range of variation respectively. The 2MASS (open triangles), IRSF (filled triangles) and SAGE (Epoch 1: open squares, epoch 2: filled squares) fluxes are also shown. The solid curve is the SAGE-Spec IRS spectrum.
Current usage metrics show cumulative count of Article Views (full-text article views including HTML views, PDF and ePub downloads, according to the available data) and Abstracts Views on Vision4Press platform.
Data correspond to usage on the plateform after 2015. The current usage metrics is available 48-96 hours after online publication and is updated daily on week days.
Initial download of the metrics may take a while.