Free Access
Fig. 1
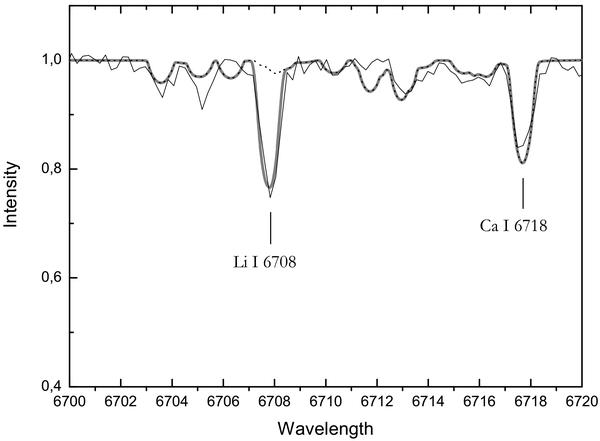
The spectrum of RZ Psc around the Li 6708 Å line (thin line). The synthetic spectra with the Li excess (100 times larger than the solar abundance) (thick gray line) and without excess (dashed line) are shown (see text for details).
Current usage metrics show cumulative count of Article Views (full-text article views including HTML views, PDF and ePub downloads, according to the available data) and Abstracts Views on Vision4Press platform.
Data correspond to usage on the plateform after 2015. The current usage metrics is available 48-96 hours after online publication and is updated daily on week days.
Initial download of the metrics may take a while.