Fig. 8
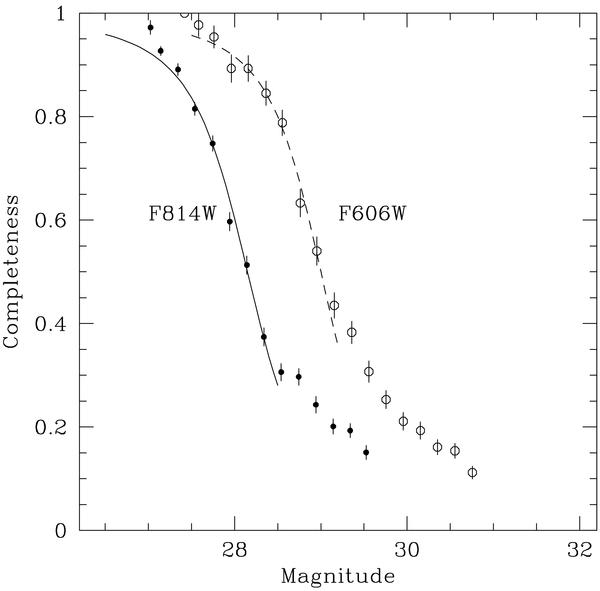
The photometric completeness as determined from the artificial-star tests in the previous figure. The ratio f represents the fraction of input stars actually found and measured in both colors, and is plotted here as a function of magnitude in each filter. The curves drawn through the brighter parts of each set of points is a standard interpolation function of the form  where m0 is the 50% completeness level and α governs the steepness of the falloff.
Current usage metrics show cumulative count of Article Views (full-text article views including HTML views, PDF and ePub downloads, according to the available data) and Abstracts Views on Vision4Press platform.
Data correspond to usage on the plateform after 2015. The current usage metrics is available 48-96 hours after online publication and is updated daily on week days.
Initial download of the metrics may take a while.