Fig. 7
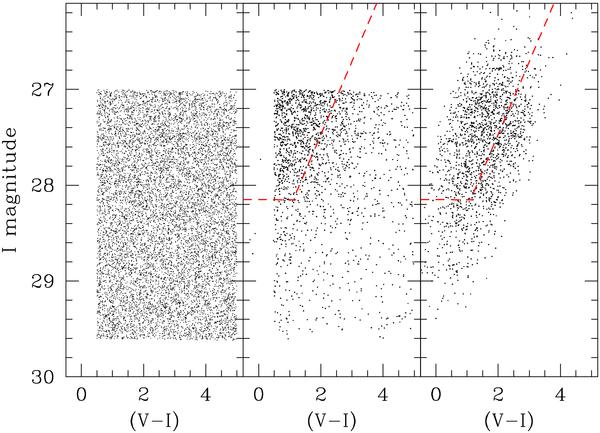
Results of the first artificial-star set of tests. Left panel shows the color–magnitude distribution of the artificial stars inserted into the region of the image described in the text. Middle panel shows the stars from the left panel that were actually found and measured on both frames. Finally, the right panel shows the measured photometry for the stars that were recovered. The heavy dashed lines in the middle and right panels show the 50% detection completeness levels.
Current usage metrics show cumulative count of Article Views (full-text article views including HTML views, PDF and ePub downloads, according to the available data) and Abstracts Views on Vision4Press platform.
Data correspond to usage on the plateform after 2015. The current usage metrics is available 48-96 hours after online publication and is updated daily on week days.
Initial download of the metrics may take a while.