Fig. 4
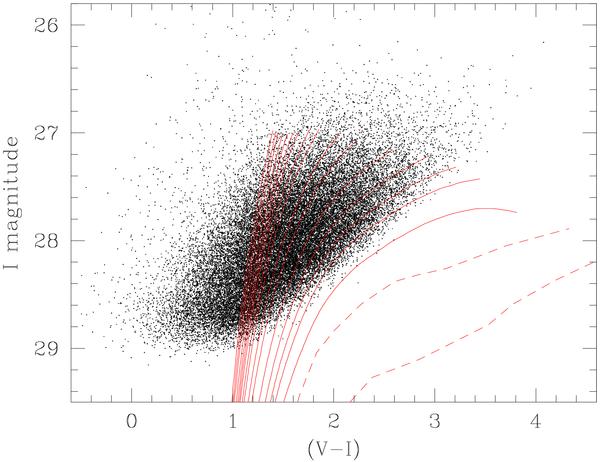
Color–magnitude distribution (I vs. (V − I)) for the measured stars in the outer radial range (115′′−155′′) of our ACS field. The superimposed solid lines are fiducial 12-Gyr RGB tracks from the VandenBerg et al. 2000 model library, in steps of roughly 0.1 dex from log (Z / Z⊙) = −2.0 to −0.1. These are supplemented with empirical tracks for two high-metallicity values at log (Z / Z⊙) = +0.16 and +0.4 (dashed lines; see Harris et al. 2002).
Current usage metrics show cumulative count of Article Views (full-text article views including HTML views, PDF and ePub downloads, according to the available data) and Abstracts Views on Vision4Press platform.
Data correspond to usage on the plateform after 2015. The current usage metrics is available 48-96 hours after online publication and is updated daily on week days.
Initial download of the metrics may take a while.