Free Access
Fig. 2
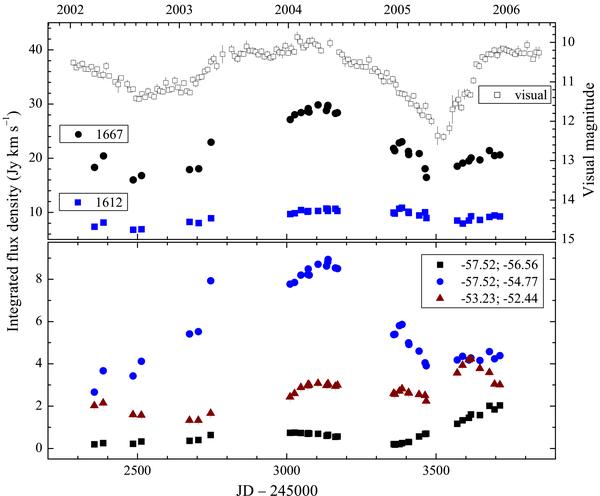
S Per. Top panel: The variations of the integrated OH flux densities (Stokes I) at 1612 and 1667 MHz. The visual mean curve (from AAVSO) with 10 day bins is added. Bottom panel: The variations of 1667 MHz flux density integrated over the selected velocity ranges indicated by symbols.
Current usage metrics show cumulative count of Article Views (full-text article views including HTML views, PDF and ePub downloads, according to the available data) and Abstracts Views on Vision4Press platform.
Data correspond to usage on the plateform after 2015. The current usage metrics is available 48-96 hours after online publication and is updated daily on week days.
Initial download of the metrics may take a while.