Free Access
Fig. 6
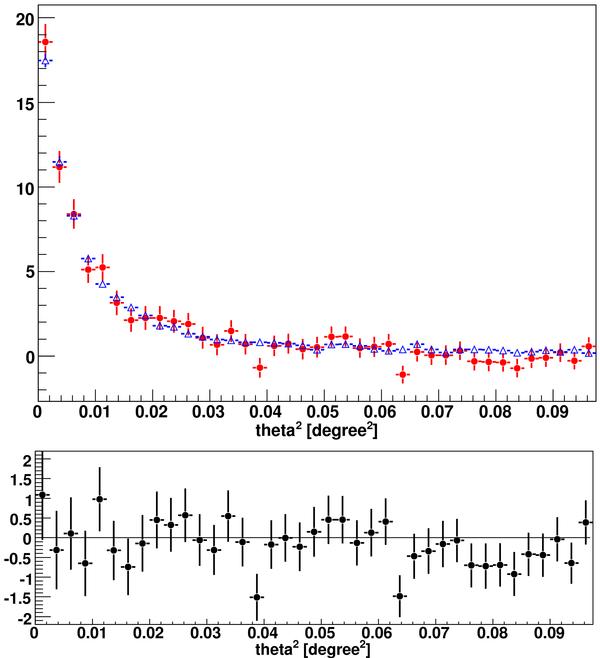
Comparison of the excess θ2 distribution for 26h of data from Mrk 501 (red circles) and a point-like source (blue triangles, 17h of Crab Nebula data) (upper panel) and the difference of both distributions (lower panel). (This figure is available in color in electronic form).
This figure is made of several images, please see below:
Current usage metrics show cumulative count of Article Views (full-text article views including HTML views, PDF and ePub downloads, according to the available data) and Abstracts Views on Vision4Press platform.
Data correspond to usage on the plateform after 2015. The current usage metrics is available 48-96 hours after online publication and is updated daily on week days.
Initial download of the metrics may take a while.