Fig. 2
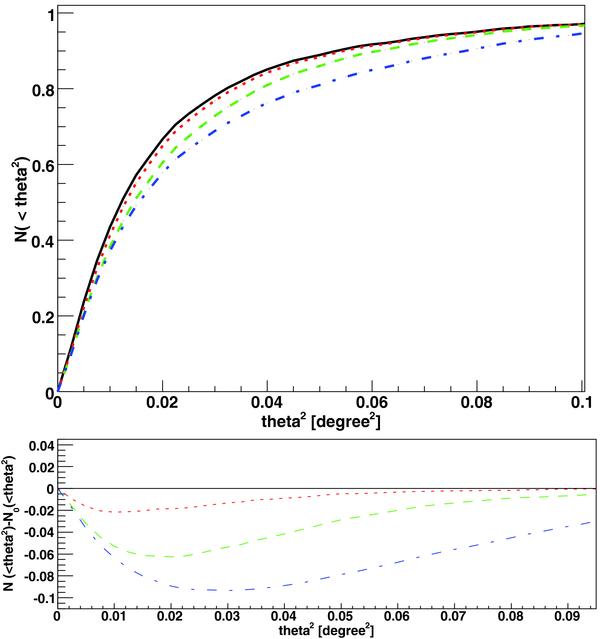
Comparison of Monte Carlo cumulative θ2 distributions (upper panel) for a source with 80% point-like and 20% extended emission and difference between them (lower panel). The characteristic radius of the extension is equal to 0.1° (red dotted), 0.2° (green dashed) or 0.3° (blue dot-dashed), respectively. The extended part of the emission is simulated as a flat disc (dN/dθ2 = const.). The purely point-like source is shown as a black solid line. A random mispointing up to 0.03° has been included in the simulations. (This figure is available in color in electronic form).
Current usage metrics show cumulative count of Article Views (full-text article views including HTML views, PDF and ePub downloads, according to the available data) and Abstracts Views on Vision4Press platform.
Data correspond to usage on the plateform after 2015. The current usage metrics is available 48-96 hours after online publication and is updated daily on week days.
Initial download of the metrics may take a while.