Free Access
Fig. 4
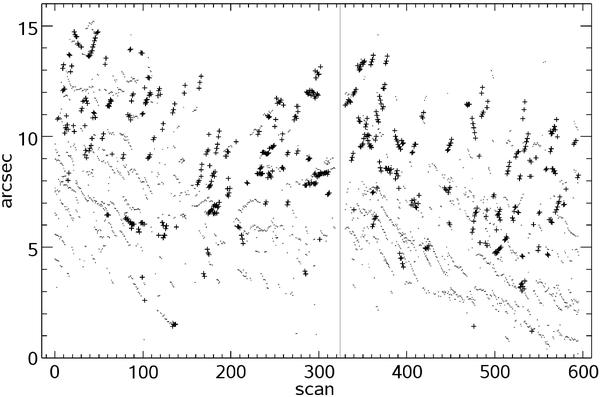
Positions of identified upflow and downflow events along the SP slit (• and + symbols) evolving during the repetitive scanning. The thin vertical line separates the datasets obtained on 2006 December 1 and 2.
Current usage metrics show cumulative count of Article Views (full-text article views including HTML views, PDF and ePub downloads, according to the available data) and Abstracts Views on Vision4Press platform.
Data correspond to usage on the plateform after 2015. The current usage metrics is available 48-96 hours after online publication and is updated daily on week days.
Initial download of the metrics may take a while.