Fig. 3
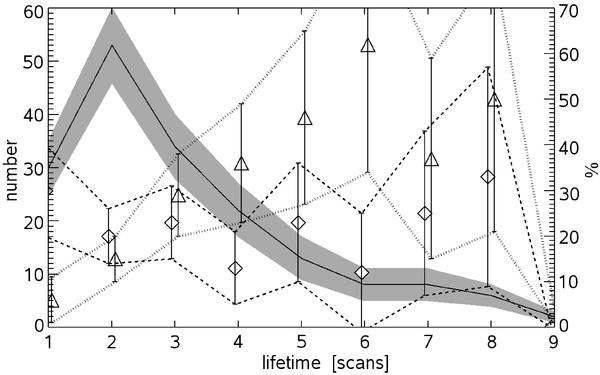
The number of identified events is marked by a solid line and the shaded area indicates its uncertainty. The ⋄ and △ symbols show the percentage of downflows that are related to chromospheric brightenings and nearby upflows, respectively. The uncertainties in these values are marked by dashed and doted lines, respectively.
Current usage metrics show cumulative count of Article Views (full-text article views including HTML views, PDF and ePub downloads, according to the available data) and Abstracts Views on Vision4Press platform.
Data correspond to usage on the plateform after 2015. The current usage metrics is available 48-96 hours after online publication and is updated daily on week days.
Initial download of the metrics may take a while.