Fig. 2
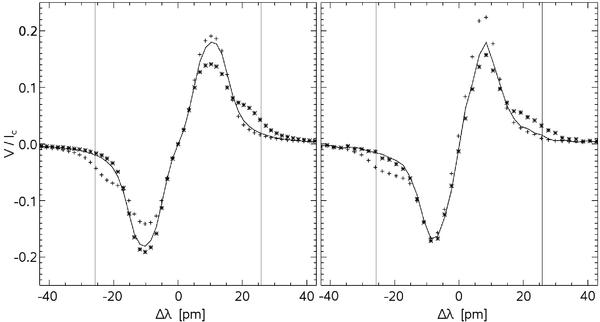
The synthetic (left) and observed (right) Stokes V profiles of Fe I 630.15 nm line. The solid lines represent the atmosphere with low LOS velocity (set to zero at all heights in case of synthetic profile). The (+) symbols represent a profile with an upflow (negative LOS velocity); observed in a bright grain and synthesised with LOS velocity set to −2.5 km s-1 below log (τ) = −0.3. The (∗) symbols represent the Stokes V profile with a positive LOS velocity; created with LOS velocity set to 2.5 km s-1 below log (τ) = −0.3 and observed in a downflow patch.
Current usage metrics show cumulative count of Article Views (full-text article views including HTML views, PDF and ePub downloads, according to the available data) and Abstracts Views on Vision4Press platform.
Data correspond to usage on the plateform after 2015. The current usage metrics is available 48-96 hours after online publication and is updated daily on week days.
Initial download of the metrics may take a while.