Fig. 8
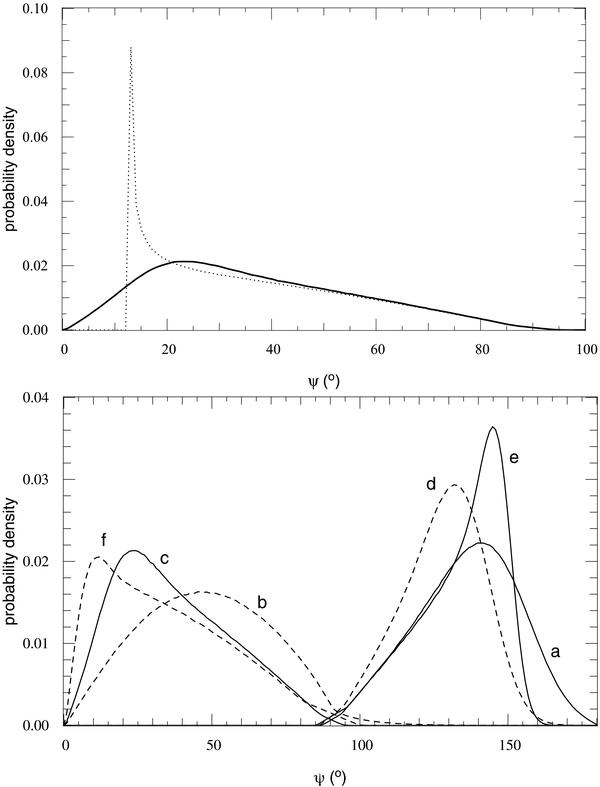
Top: Smoothed histogram of the ψ distribution for WASP-5b. The dotted line is when errors on i and β are set to zero. The plain curve shows the same conversion from β to ψ but with all errors accounted for. Bottom: 6 smoothed histograms of the distribution in ψ our six targets: a) WASP-2b; b) WASP-4b; c) WASP-5b; d) WASP-15b; e) WASP-17b; f) WASP-18b. Bins are of 1°.
Current usage metrics show cumulative count of Article Views (full-text article views including HTML views, PDF and ePub downloads, according to the available data) and Abstracts Views on Vision4Press platform.
Data correspond to usage on the plateform after 2015. The current usage metrics is available 48-96 hours after online publication and is updated daily on week days.
Initial download of the metrics may take a while.