Fig. 3
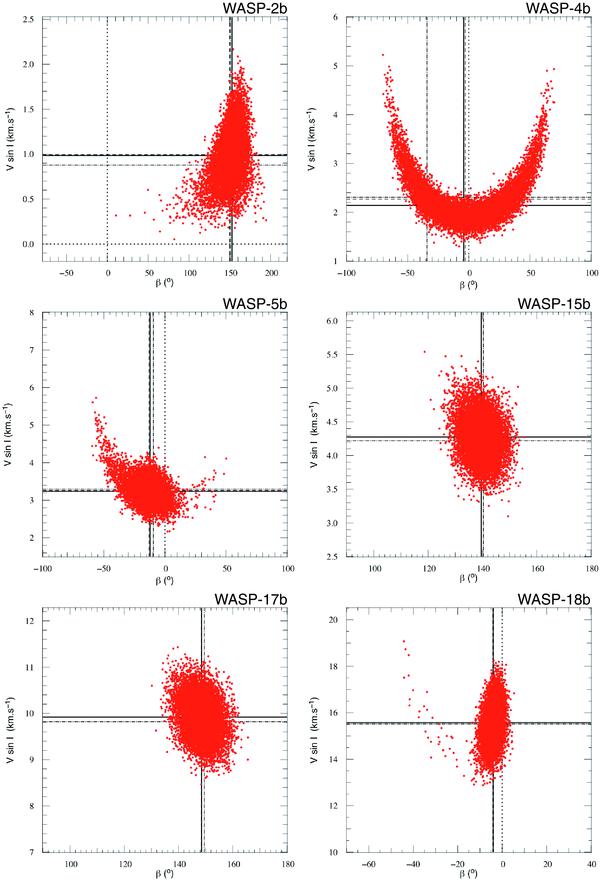
Posterior probability distribution issued from the MCMC showing the resulting distributions of points between VsinI and β for our six WASP targets. These distributions are issued from the chains that gave our preferred solutions as explained in the text. The dotted lines show where zeros are, the straight lines represent the medians of the distributions, the dashed lines plot the positions of the average values, the dash-dotted lines indicate the values with the lowest χ2 (some lines can overlap). The scale of the boxes was adapted to include the whole distibutions.
Current usage metrics show cumulative count of Article Views (full-text article views including HTML views, PDF and ePub downloads, according to the available data) and Abstracts Views on Vision4Press platform.
Data correspond to usage on the plateform after 2015. The current usage metrics is available 48-96 hours after online publication and is updated daily on week days.
Initial download of the metrics may take a while.