Fig. 10
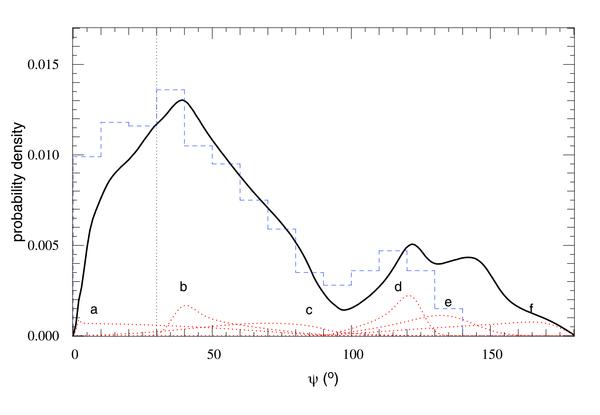
The above histogram transformed into the real angle ψ in solid line and smoothed to bins of 1°. Red dotted curves show key individual objects in order to illustrate some of the features of the overall distribution. The blue dashed histogram is the reproduction of the theoretical histogram published by Fabrycky & Tremaine (2007) and solely plotted over. a) HD 189733b; b) XO-3b; c) HD 80606b; d) WASP-8b; e) WASP-15b; f) Hat-P-7b. The black dotted line shows ψ = 30°. Above that, planets are considered misaligned.
Current usage metrics show cumulative count of Article Views (full-text article views including HTML views, PDF and ePub downloads, according to the available data) and Abstracts Views on Vision4Press platform.
Data correspond to usage on the plateform after 2015. The current usage metrics is available 48-96 hours after online publication and is updated daily on week days.
Initial download of the metrics may take a while.