Fig. 7
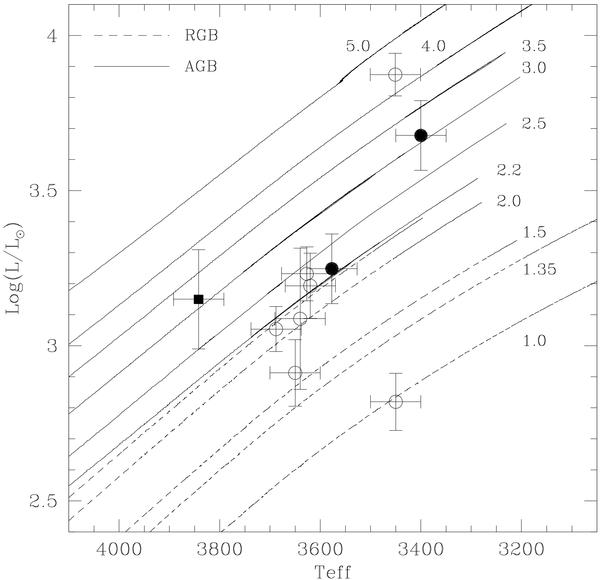
Position in the H-R diagram of EK Boo and other M giants, adopting Teff from the literature, parallaxes from the New Reduction Hipparcos catalogue by van Leeuwen (2007), V magnitudes from the 1997 Hipparcos catalogue, and bolometric corrections from Buzzoni et al. (2010). EK Boo’s position (filled circles) is shown for two different effective temperatures (3420 K and 3577 K, see text). β And, another Zeeman detected M giant, is represented by a filled square. Standard evolutionary tracks for solar composition and various initial stellar masses (as indicated) are also plotted (Lagarde & Charbonnel, in prep.). Dotted lines show the evolution up to the tip of the first ascent (the RGB) for the low-mass models (1.0 to 2.2 M⊙), while AGBs are indicated by solid lines for the intermediate-mass stars (2.2 M⊙ and above). For clarity, only the 2.2 M⊙ model is shown with both RGB and AGB.
Current usage metrics show cumulative count of Article Views (full-text article views including HTML views, PDF and ePub downloads, according to the available data) and Abstracts Views on Vision4Press platform.
Data correspond to usage on the plateform after 2015. The current usage metrics is available 48-96 hours after online publication and is updated daily on week days.
Initial download of the metrics may take a while.