Free Access
Fig. 6
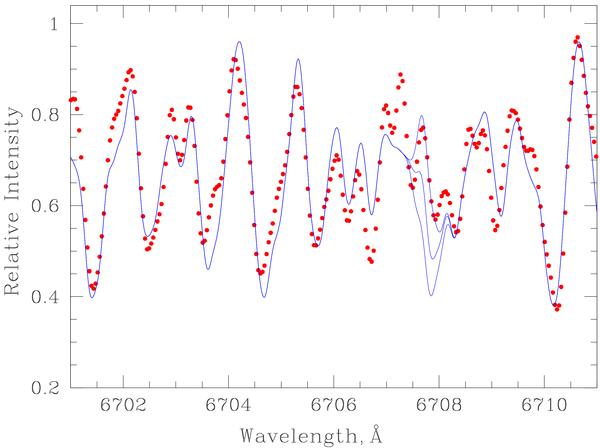
Observed (dots) and synthetic (solid lines) spectra for EK Boo in the region around the Li i 6708 Å resonance line, the observed spectrum is scaled in intensity for a good match. The synthetic spectra represent lithium abundances of log ε(Li) = − 1.0, 0.0, and +1.0.
Current usage metrics show cumulative count of Article Views (full-text article views including HTML views, PDF and ePub downloads, according to the available data) and Abstracts Views on Vision4Press platform.
Data correspond to usage on the plateform after 2015. The current usage metrics is available 48-96 hours after online publication and is updated daily on week days.
Initial download of the metrics may take a while.