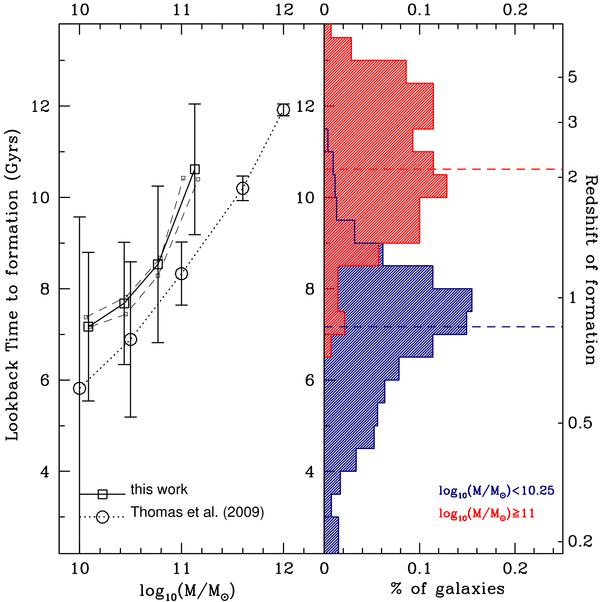
Fig. 10

Stellar mass as a function of lookback time to formation (left panel) and mass histograms of extreme tertiles for ETGs. Squared symbols represent our data, where the errorbars plotted are the dispersions in the measurements. Circle points are data taken from the analysis of SDSS-DR4 by Thomas et al. (2009), showing the lookback time at which the 50% of the stellar mass has formed; the errorbars plotted are the differences between the lookback time of formation of 50% and of 80% of the stellar mass. The dashed lines represent the mass-lookback time relation computed in the extreme quartiles of overdensity. To compare data here we adopted Ωm = 0.24, ΩΛ = 0.76, and H0 = 73kms-1 Mpc-1.
Current usage metrics show cumulative count of Article Views (full-text article views including HTML views, PDF and ePub downloads, according to the available data) and Abstracts Views on Vision4Press platform.
Data correspond to usage on the plateform after 2015. The current usage metrics is available 48-96 hours after online publication and is updated daily on week days.
Initial download of the metrics may take a while.


