Free Access
Fig. 8
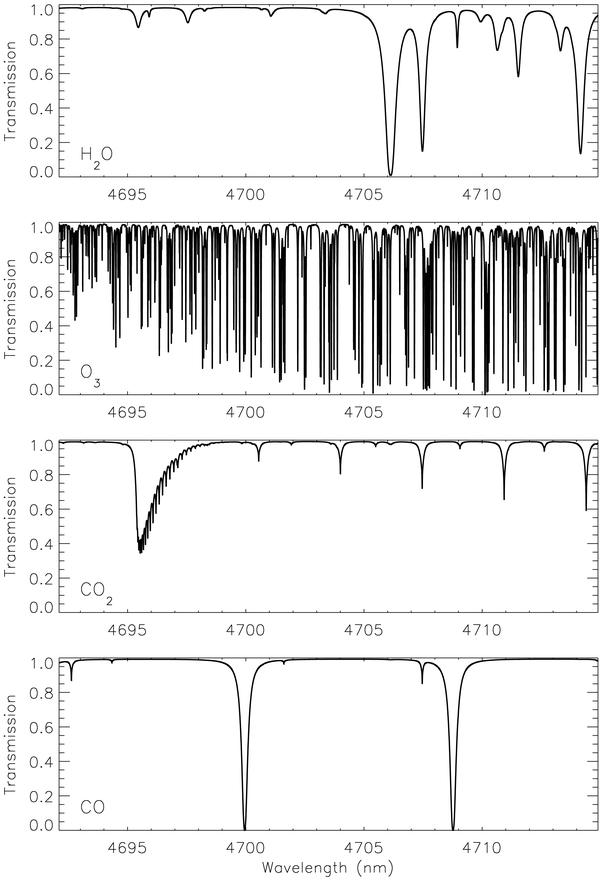
Transmission of the individual species involved in the spectral region shown in Fig. 9. From top to bottom: water vapour (H2O), ozone (O3), carbon dioxide (CO2), and carbone monoxide (CO). The transmissions are shown before convolution with the instrumental profile.
Current usage metrics show cumulative count of Article Views (full-text article views including HTML views, PDF and ePub downloads, according to the available data) and Abstracts Views on Vision4Press platform.
Data correspond to usage on the plateform after 2015. The current usage metrics is available 48-96 hours after online publication and is updated daily on week days.
Initial download of the metrics may take a while.