Free Access
Fig. 11
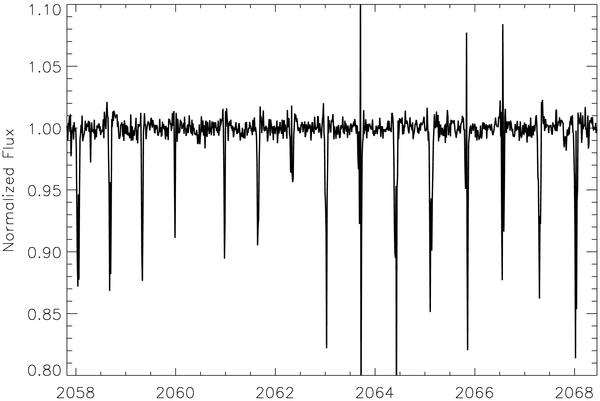
Division of two spectra from consecutive nodding positions of the same star shown in Fig. 5. The spectrum from nodding position B was mapped on the wavelength scale of of the spectrum from nodding position A before the division. The difference in airmass is only 0.005. See Fig. 5 and text for details.
Current usage metrics show cumulative count of Article Views (full-text article views including HTML views, PDF and ePub downloads, according to the available data) and Abstracts Views on Vision4Press platform.
Data correspond to usage on the plateform after 2015. The current usage metrics is available 48-96 hours after online publication and is updated daily on week days.
Initial download of the metrics may take a while.