Free Access
Fig. 3
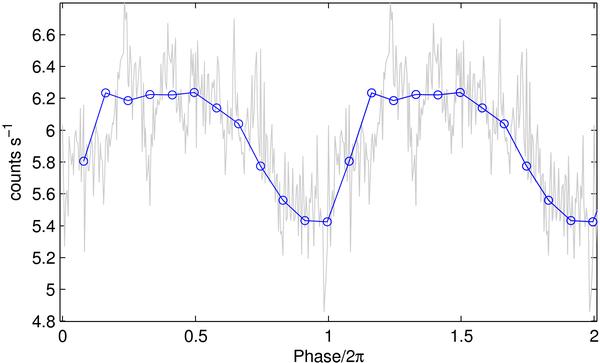
Folded light curve with a period of 24 ks (blue line), derived for the second part of the light curve from Fig. 1, i.e from 2.5 × 10⁴ s till the end of the data (gray line); plotted over two periods for clarity.
Current usage metrics show cumulative count of Article Views (full-text article views including HTML views, PDF and ePub downloads, according to the available data) and Abstracts Views on Vision4Press platform.
Data correspond to usage on the plateform after 2015. The current usage metrics is available 48-96 hours after online publication and is updated daily on week days.
Initial download of the metrics may take a while.